The Aperture Governance Studio Profiling suite allows a user to take a deeper dive into the analysis of their data; the profiling tool uses intelligent machine learning to group metadata, recognize trends, and detect outliers for systems, tables and columns. The analysis in the Profiling section includes but is not limited to:
The profiling process relies on data derived from the MetaData section. Before using the profiling functionality, they user has to ensure that the MetaData section has been correctly populated. You can find further details on this here: metadata
The profiling section consists of 3 parts and includes:
The profiling dashboards display the profiling results and the analysis areas listed above. This is displayed in a tabular and visual format, allowing the user to select the relevant table and perform deep dives into the columns. This is displayed at an aggregated level - can't drill into specific examples, and is static view based on the date the profiling was run (results don't automatically update).
To start, Select the System and Table (Shown in the window below).

After the System and Table have been selected, the screens below will appear. They include:
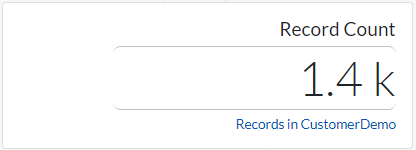
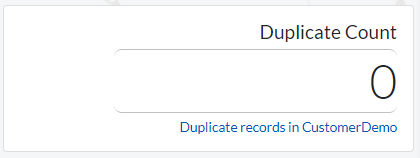

After you click/select a particular row in the profile summary window (above), several windows/charts will appear displaying some further analysis of the selected item. These include:
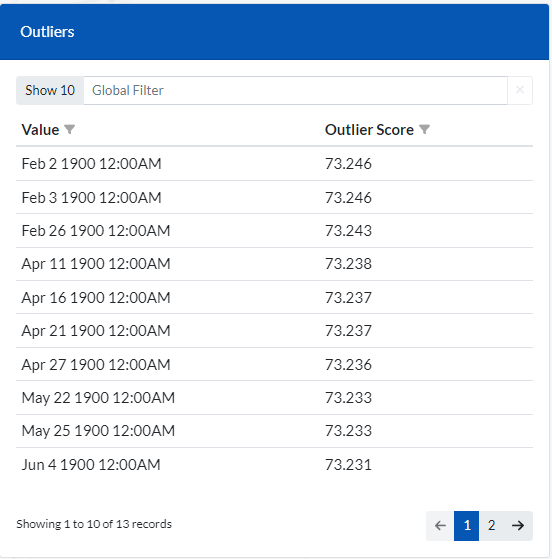
A window displaying the Outliers items found and their Outlier score. If no outliers are found in the selected column, this screen will be empty with the message "No data to display".
To filter to a specific outlier item, simply enter the item in the Global Filter section.
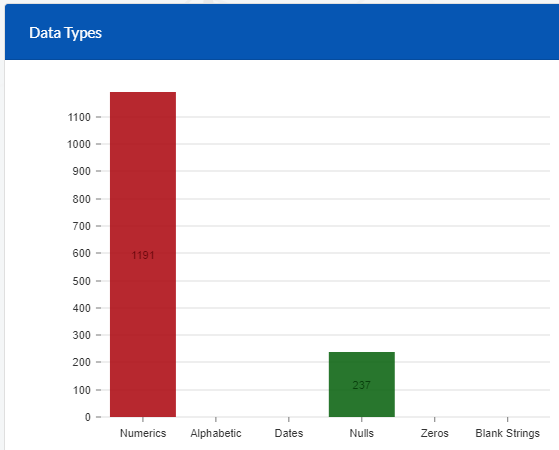
The chart displays the split of datatypes in the selected item (column).

A chart that displays a breakdown of the length for the values found in the column.
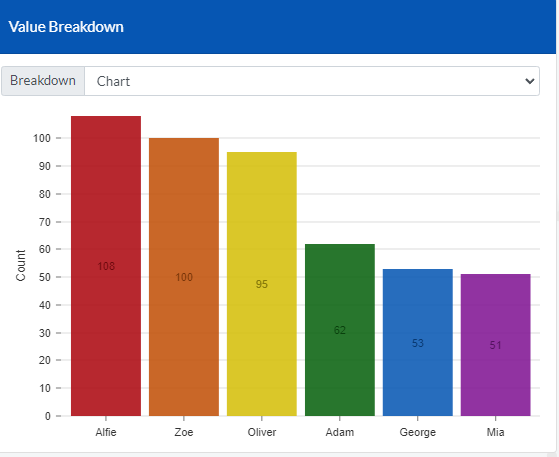
A chart/table displaying the split of values in the selected column. It only applies to categorical columns (Columns with limited number of values).
To switch to table view simply click on the drop down list next to the ‘Breakdown’ label.
These inisghts are intended to assist the user to quickly establish data quality rules, these may include columns that aren't fully populated where they should be, columns that have some data held within them that is the wrong data type, columns that are too long in length e.g. address line that actually contains the full line of the address or where there are some high propability outliers e.g. where the title contains a first name reference rather than Mr, Mrs, Miss, Ms or Dr. Since profiling can offer provide the first phase of data quality rules, it is recommended that profiling is performed before visiting the Rule creation process.
The Profiling Control Panel is where the Profiling jobs are created and executed. A detailed history of the profile jobs run so far can also be viewed in this section.
Go to (Profiling > Control Panel).
The control panel consists of the several windows below:

The table contains a list of all tables available to be profiled. If a table has already been profiled a tick will be displayed in the Profile column. These tables will be available for analysis in the Profiling > Dashboard section.
The user can use the global search or the individual columns to filter to find the table(s) they wish to profile. Once the table is located, the user can click on the table and go the the top right where it displays run profile, here you can choose whether to run with trim values or outliers. Due to the nature of the configuration, it's recommended that only one profiling job is run at once, especially if the table being profiled is large in size.
The user can profile a job more than once, for example if the client has recently updated the table and wants to know the profiling effect, they may wish to re-run the profiling of that table, this will overwrite the previous profiling results.

The latest profile will display the process diagram of the latest table profiled, this can change to other tables by selecting a job (discussed in the next paragraph). The process includes header, summary and outlier steps - the header step is essentially looking at the table structure, the summary is analysing each column, the number of columns will be displayed here e.g. 10/10 and then the outliers is specifically looking at the outliers in each column. The outliers is calculated by taking into acount approximately 8 different factors and produce the probability that an entry in a column doesn't fit the norm. As you run a job you will see this process ticking over, green ticks mean the step has been successful, orange means that there has been some issues but the process has been able to carry on and lastly a red cross will indicate a bigger issue, for any issues you can click view detail to see the corresponding error message.

Within this section you can select different profile jobs, which will change the latest profile above to a previous profile result, this again will allow the user to see any error messages. It also provides the user with run time information and overal success.

The calendar window highlights the days of the month in which Profiling jobs were run. Each block within a month represents a day. The intensity of the colors on the blocks (days) depends on how many jobs were run on that particular day. The more intense the color, the more number of jobs were run on that day
This section enables the user to view the raw dataset directly. Before the user can access this section, they have to be assigned rights by an Admin user. These rights are set in the MetaData > Systems area.
Go to (Profiling > Data Browser).
Enter the system and table that you would like to access in the window below

You will be presented with a view of your actual data as shown in the window below.

When viewing the dataset in the above window, you can sort by (ascending or descending) by clicking on any column. You can also filter on any column by simply clicking the filter icon next to each column title.

Use the Global filter input box to filter to specific records.
Set the number of records to display on a single page by clicking on the Show 10 label. It is set to display 10 records per page by default.
Clicking on the CSV & Excel icons downloads the dataset to the required format.